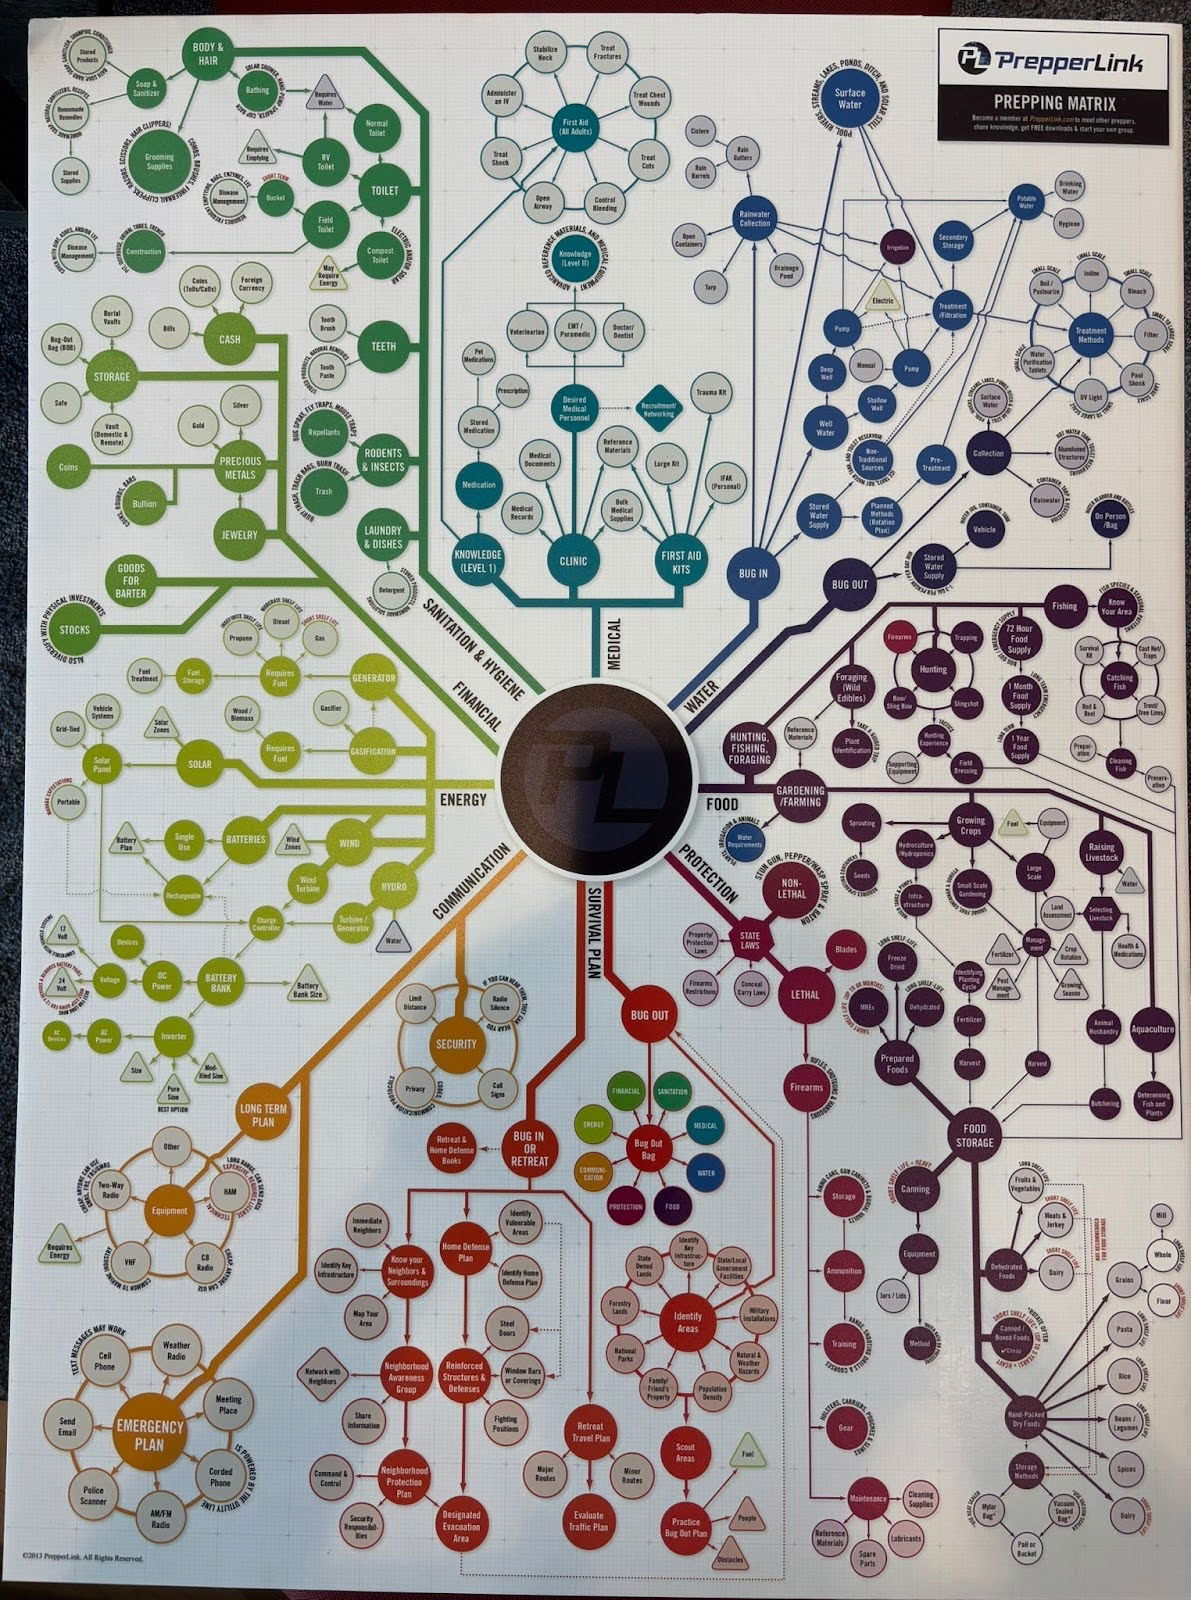
I didn't actually read through all of these different scenarios, but this is a cool graph for a prepper (someone who wants to stay safe in case of an emergency).
Analyzed by Swipebot
Loading analysis...
Search for a command to run...

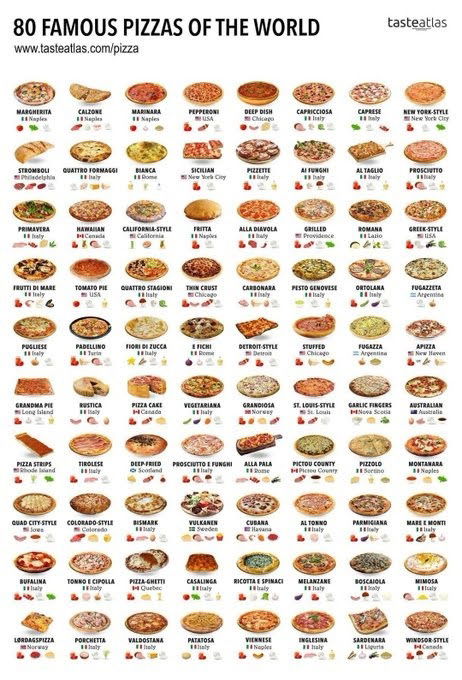
This chart takes 80 different pizzas, lists out where they’re from and also some other qualities about them. I like...
To me, an image like this packs in a lot of data in a very easy-to-understand method.

Having a longterm goal is very important.If you don't, you might just do random things that add up to nothing...
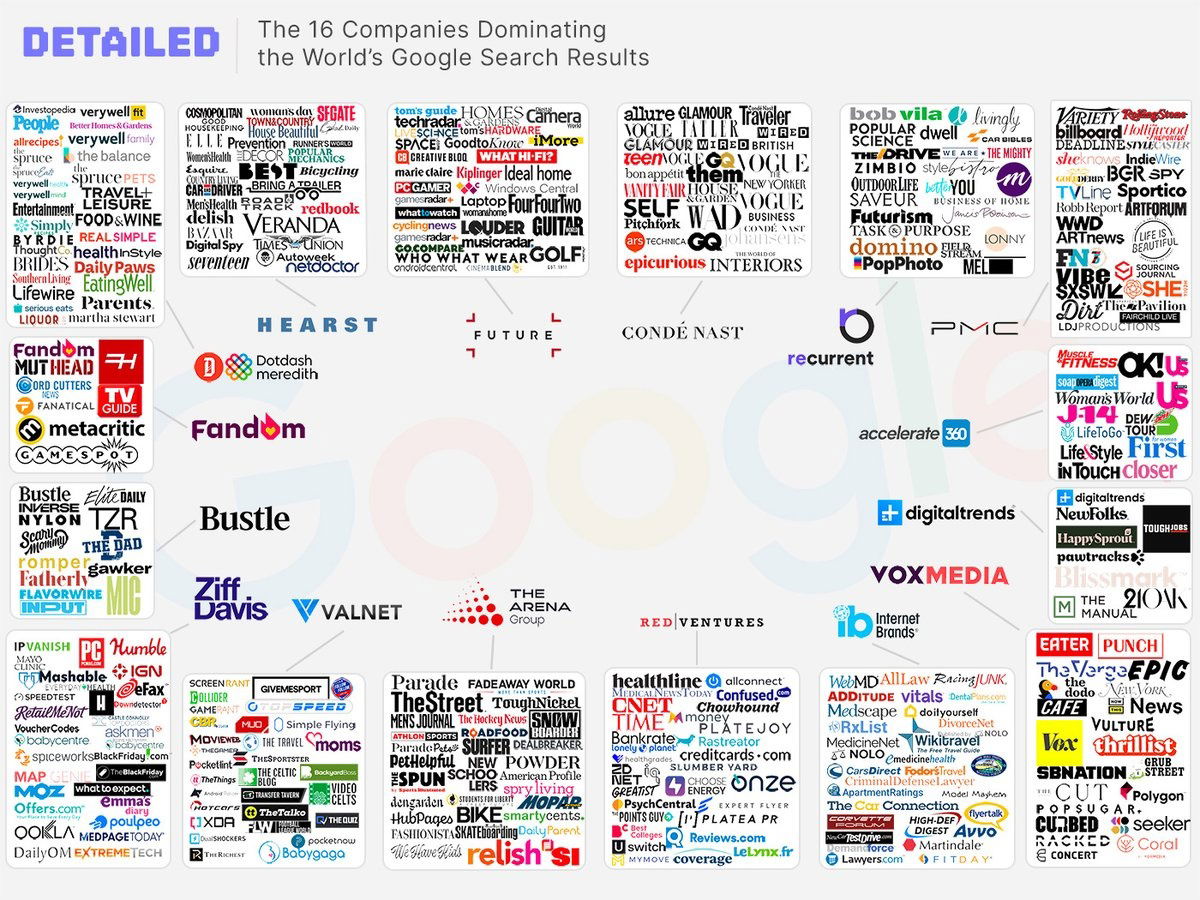
This image shows how 16 main brands control the SEO on google. Why I think the review industry sucks:basically 16...

This chart shows that the top 50% of New Yorkers paid 99.8% of income taxes in 2023.
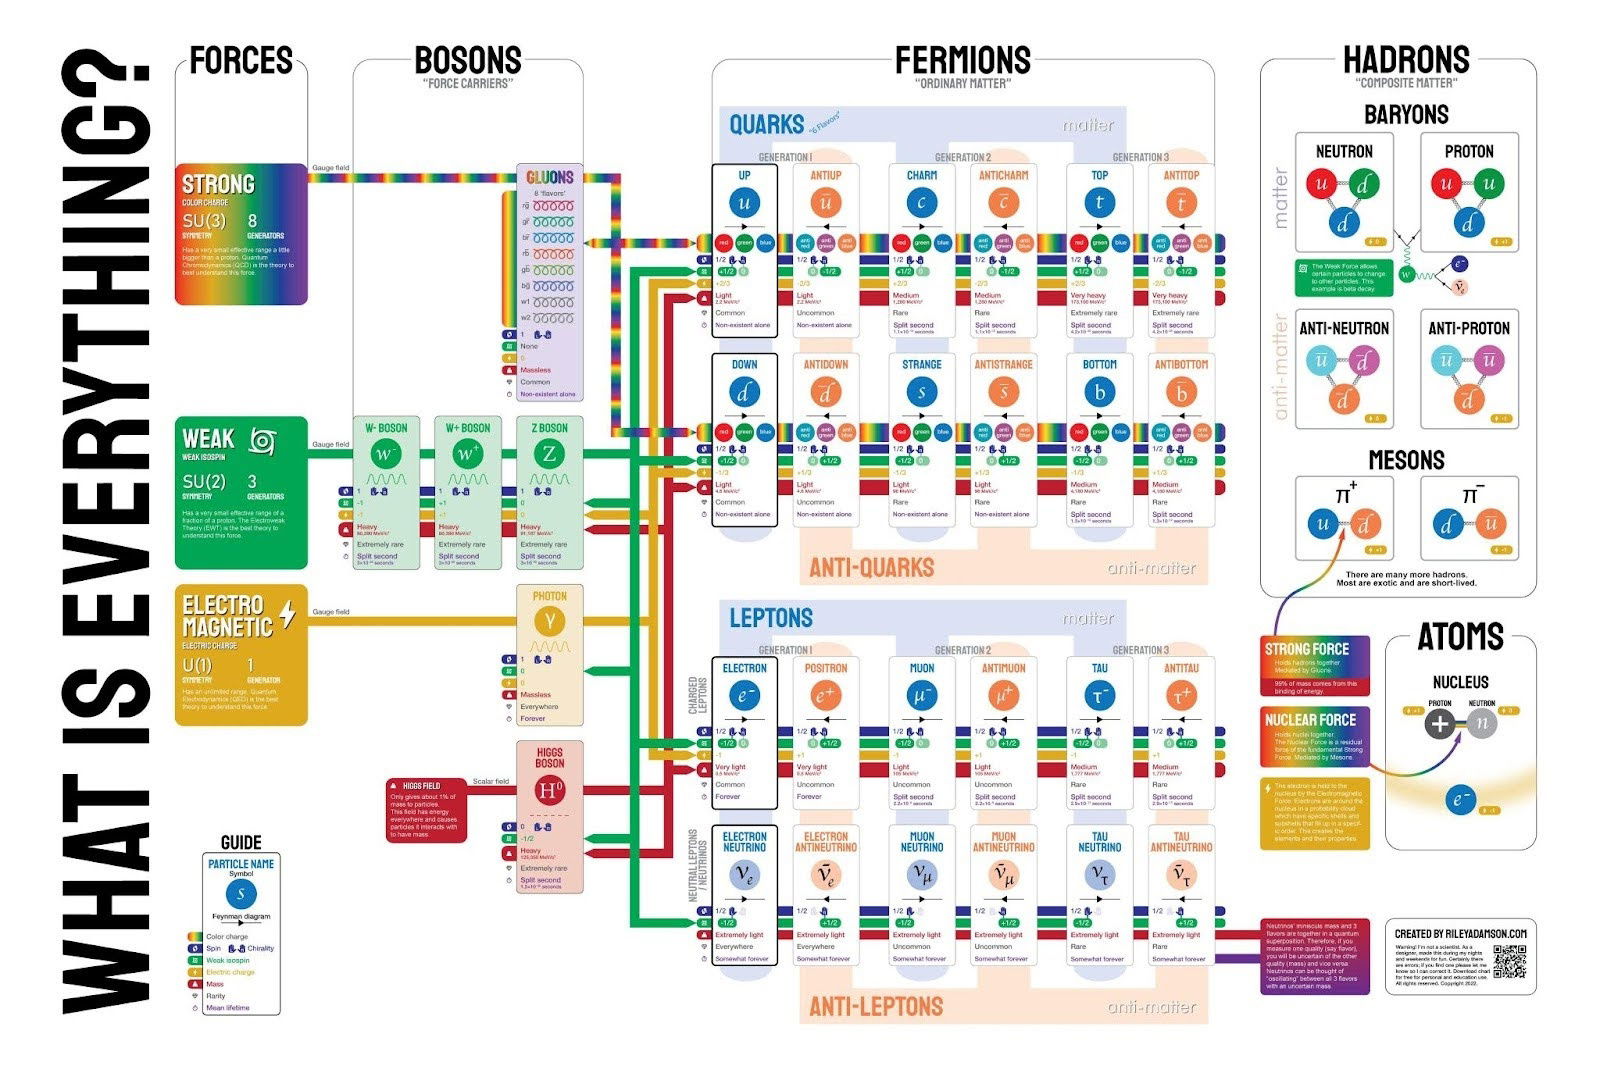
This isn't a very simple graphic, but it shows what everything is based down to the fundamental particles that we...