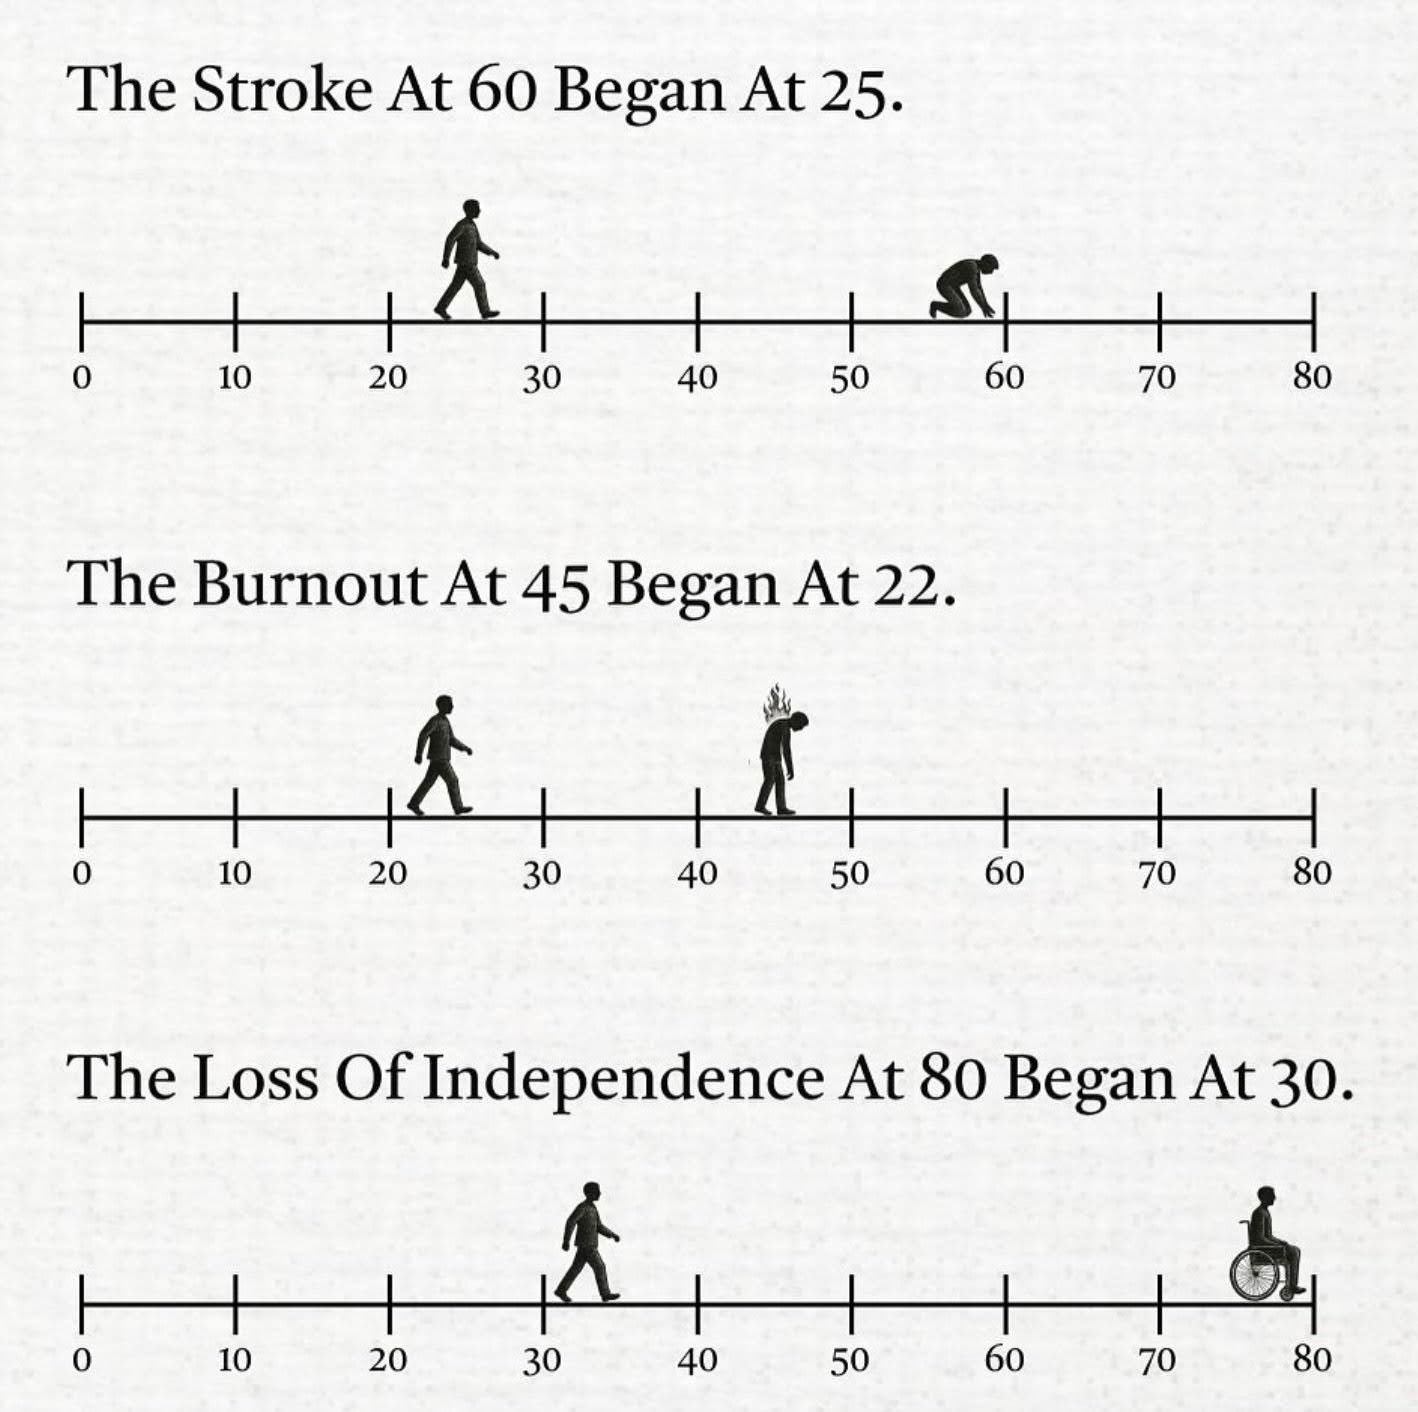
Impactful timeline showing how events progressed. If you take steps earlier in prevention of strokes, burnout and independence.
Analyzed by Swipebot
Loading analysis...
Search for a command to run...

To me, an image like this packs in a lot of data in a very easy-to-understand method.
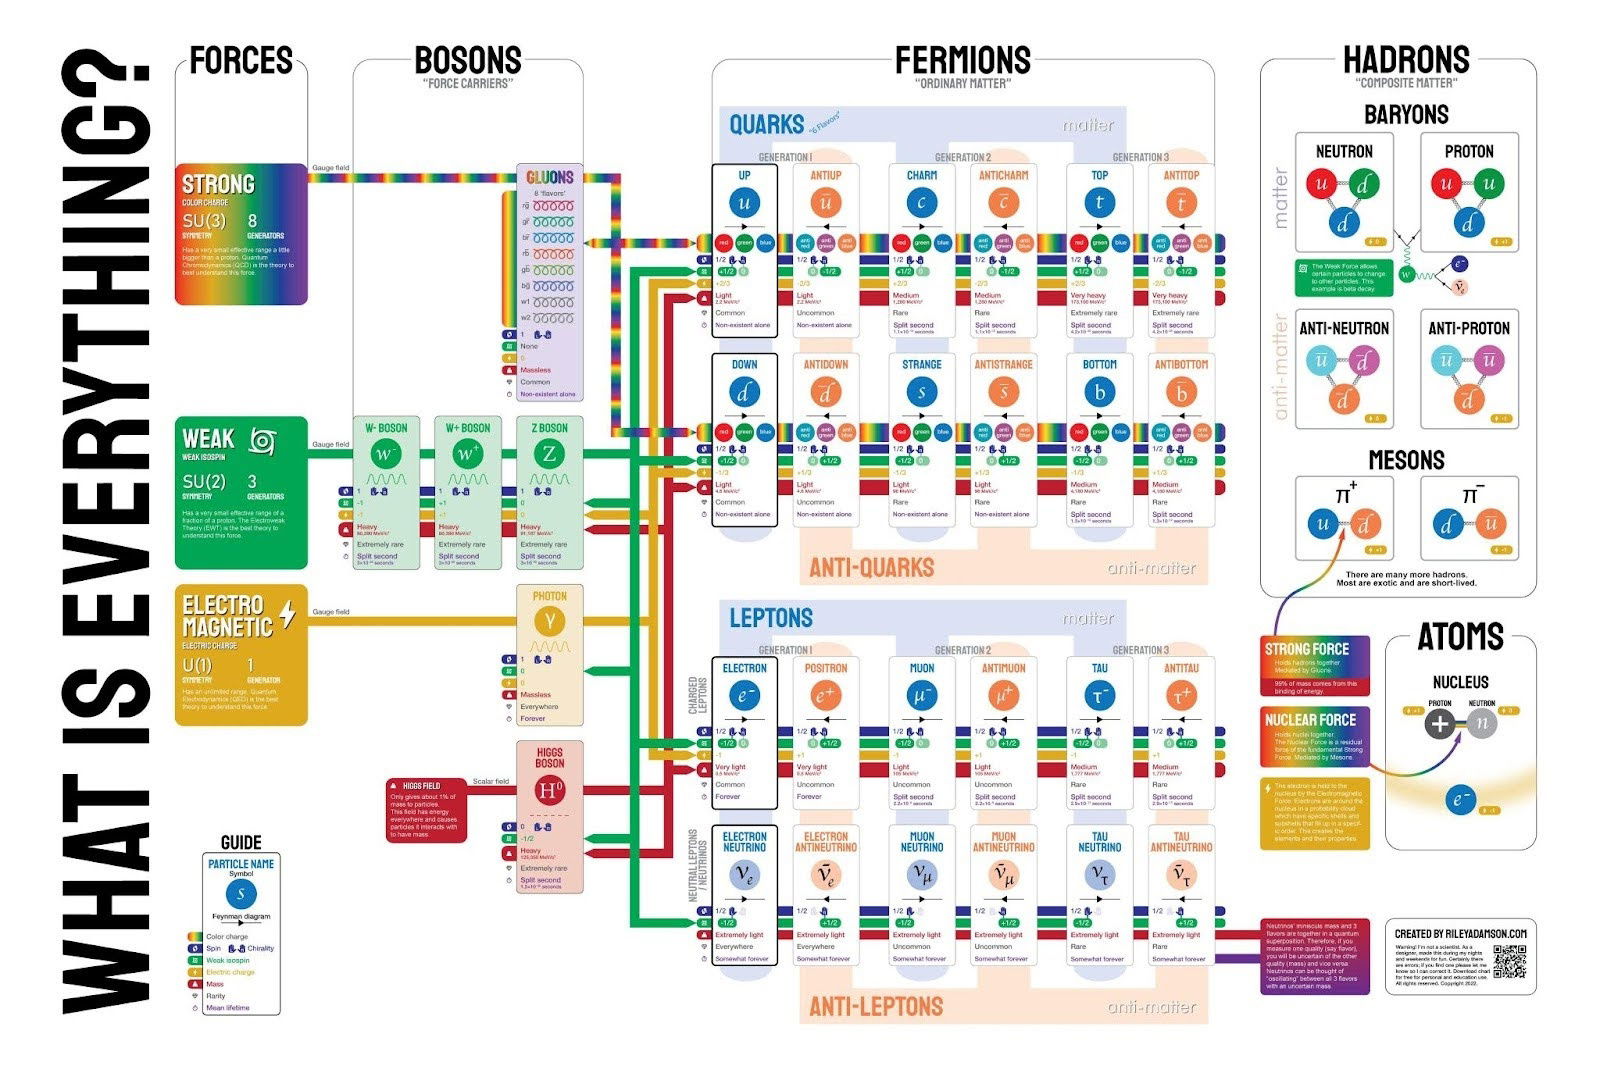
This isn't a very simple graphic, but it shows what everything is based down to the fundamental particles that we...
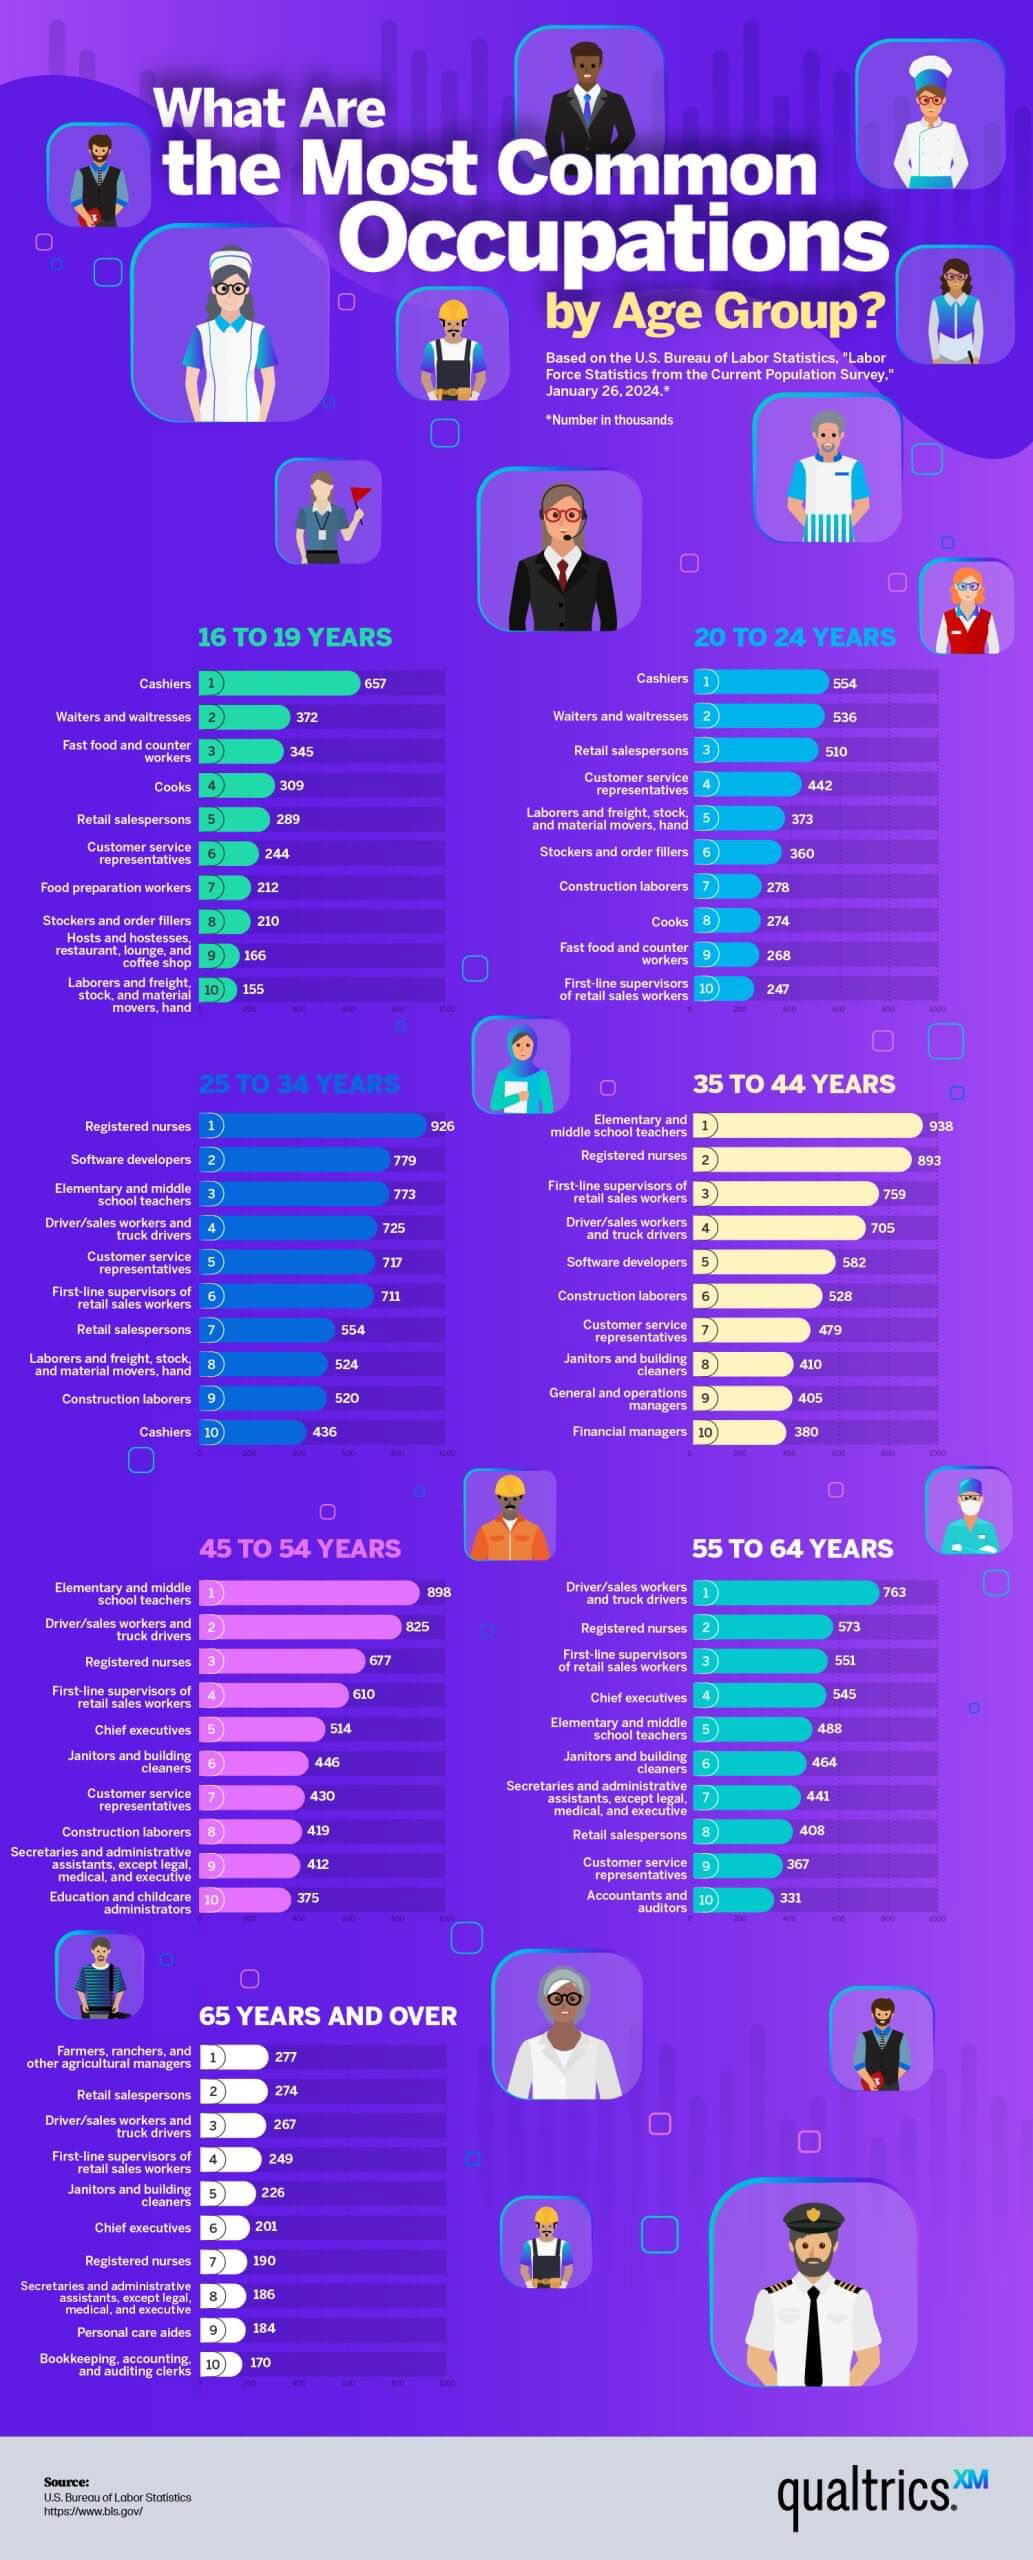
This was an interesting way to show data of the most common jobs by AGE.The data showed:16 to 24 years:...
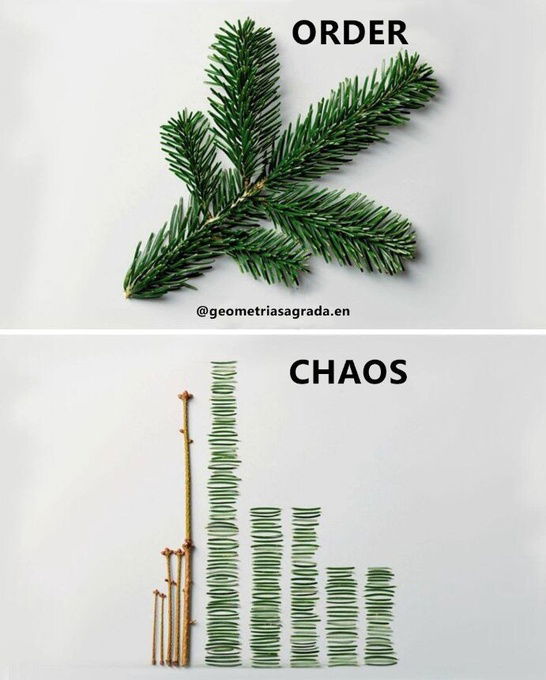
This is a cool visualization of an assembled plant in complete order, but then disassembled it looks like just random...
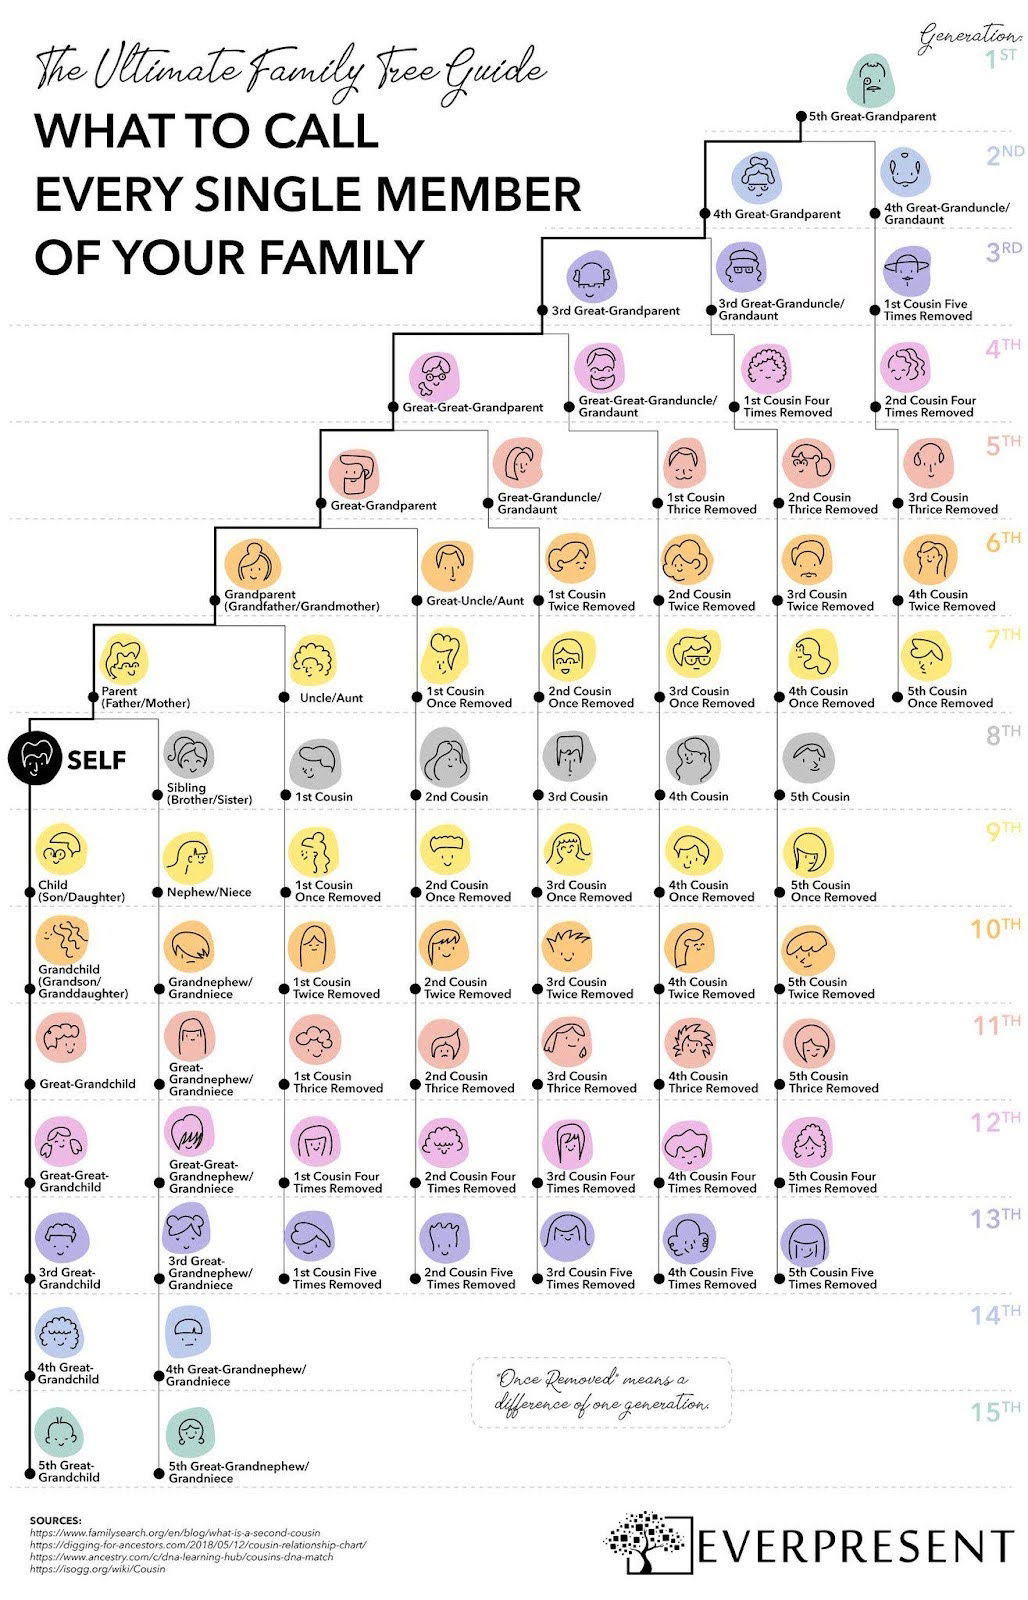
This colorful one-pager breaks down what to call every single family member—across 15 generations.
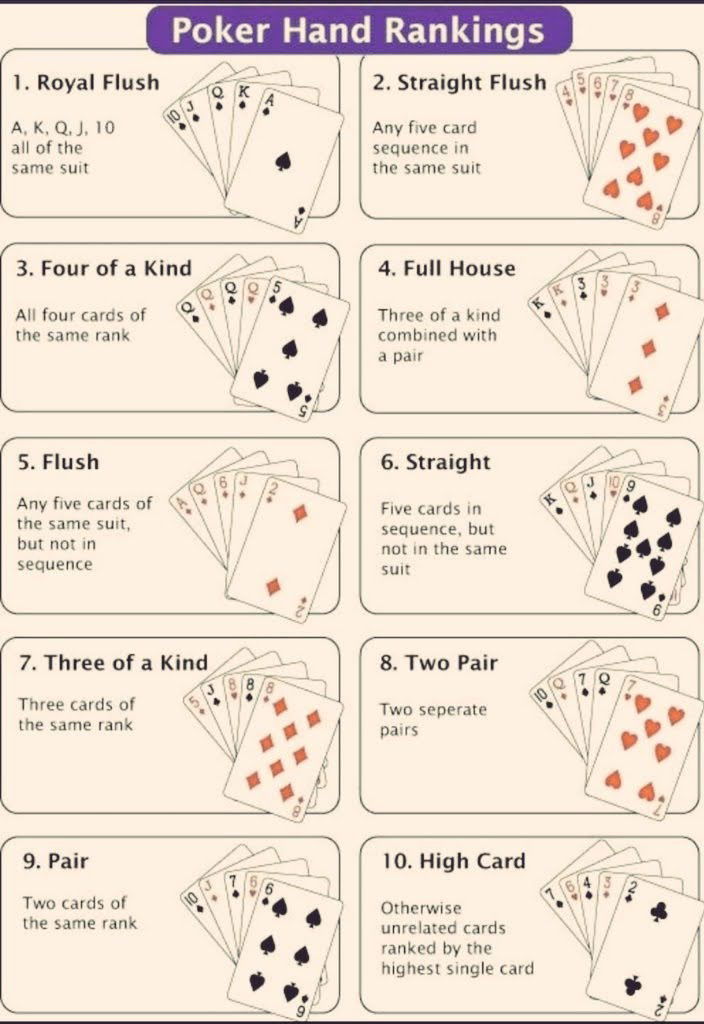
A quick cheat sheet of poker hand rankings — from best to worst. I like simple little charts like this...